
The decision by the British Home Secretary Jacqui Smith to reclassify cannabis as a Category B drug, despite the opposing views of her expert advisers, has reminded me of the chaotic state of Britain’s drugs policy. It is an area where policy has remained completely immune to evidence – as one ‘killer chart’ demonstrates.
I first came across this chart which working on a set of scenarios for Foresight’s Brain Science, Addiction and Drugs project a few years ago – perhaps not surprisingly since Professor David Nutt. one of its creators, was a project adviser. (The other creator is Colin Blakemore, a former Chief Executive of Britain’s Medical Research Council.) The version here is from the Royal Society for the Arts’ Commission on drugs, published last year.
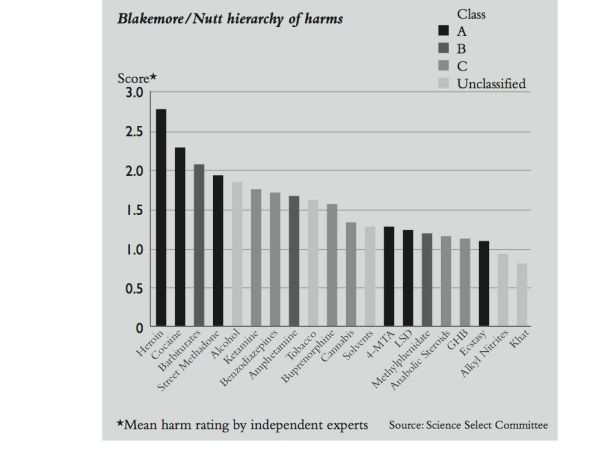
If the UK had a sensible drugs policy, there would be a reasonable correspondence between the colours and the ‘harm’ levels (the scores along the left hand edge); A-classification blacks would congregate at the left hand side, unclassifieds towards the right hand, with perhaps a few where their ‘external’ costs had changed their social impact and therefore their classification. The actual correlation is little better than random. The reason – several decades of knee-jerk political responses to drugs issues by successive Home Secretaries. Anthony Barnett has a wry post about this over at Our Kingdom. And, for the record, cannabis consumption in the UK is declining, according to the British Crime Survey, even if some strains are getting stronger.
