
This is one of those posts where a picture is worth a thousand words.
It’s prompted, of course, by the news that the Home Office has turned down flat a recommendation from the UK’s Advisory Council on the Misuse of Drugs that the classification of ecstasy should be downgraded from Class A, where it sits alongside heroin and crack cocaine, to Class B, in line with cannabis and amphetamines.This would have nudged the legal assessment a little closer to the evidence of harm – as shown by the chart below the fold.
According to the Times, the ACMD’s review of research says that while “ecstasy poses a significant public health risk in the UN with up to 5m tablets taken every month … there was very little evidence of damage to society, compared with those caused by alcohol use or hard drugs such as heroin. Further: “MDMA appears to have little acute or enduring effect on the mental health of the average user and, unlike amphetamines or cocaine, it is seldom implicated in significant episodes of paranoia”, the review said. In other words, harm to users is relatively low, there are relatively few ‘external costs’ to society in ecstasy consumption which would justify a tough classification.
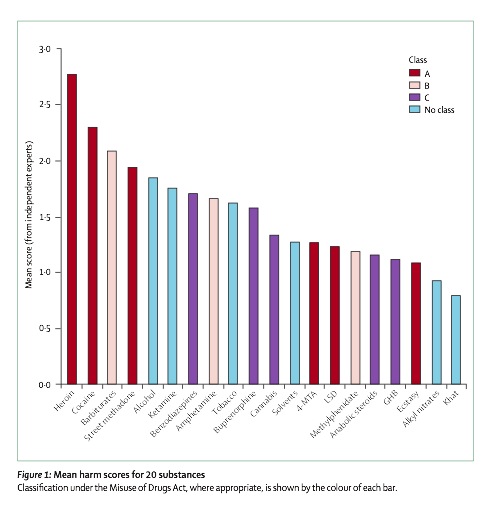
The chart below shows the relationship between evidence of harm of a drug and its UK’s classification, and was developed by David Nutt and Colin Blakemore, the former Chief Executive of the Medical Research Council, and published in an article in The Lancet in 2007. (The article can be found here, in pdf; there is a summary of the method here). I first came across an earlier version of this when working on the scenarios for Foresight’s Brain Science, Addiction and Drugs project, on which Professor Nutt was a lead adviser. It is based on a ‘matrix of harm‘ based on nine parameters grouped into three headings (physical harm, dependence, and social harm).
The relationship between the science on the harm, and the legal classification, is all but random.The dark red columns are Class A drugs: if our drugs laws were based on evidence of harm, we’d see a steady progression from dark red bars, through pink, to purple at the right – with no blue columns. Alcohol, by the way, is fifth from the left, tobacco towards the middle, and ecstasy third from the left.
The chart was also referenced in the Royal Society of the Arts’ Drugs Commission which was also published in 2007. The RSA report has good sections on the history of drugs policy and the way that drugs get demonised.
Revised to incorporate further supporting material after comments from readers, 17th February 2009.
